A FEW POINTERS ON DISPLAY KEY OPERATION:
During normal operation, the display will cycle through available data. The display changes to a different screen every 5 seconds, or screens may be scrolled manually by pressing the UP (2nd key from display) and DOWN keys (3rd key from display). Either way, pressing the ESC key (right next to the display) calls back the previous menu.
Fig. 1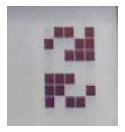 |
Fig. 2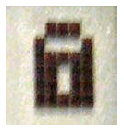 |
Auto-scroll is indicated by 2 arrows in the top left corner of the display (see Fig.1). To stop auto-scroll, press the ENTER key (4th key from display). A padlock will appear (see Fig.2).
1A) If the measurements taken previously are found to be correct, the system will proceed to the next checks. The 12 screens outlined below are shown alternately as listed in this section.

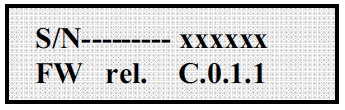
2A) shows inverter serial number and firmware revision level.
3A) E-tod: Daily energy output.
$-tod: Daily energy savings. Value is expressed in the set currency.

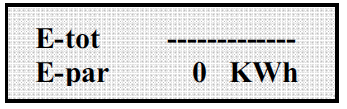
4A) E-tot: Lifetime energy output (since first installation) E-par: Partial energy output (during selected period)
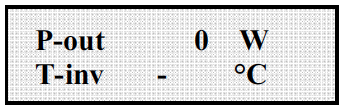
5A) P-out: Measured instant output power
The second line of the display shows the higher of two temperatures:
T-inv: inverter heat sink temperature or
T-boost: Heat sink temperature
6A) Ppk: Maximum peak power achieved since partial counter was activated Ppk Day: Maximum peak power achieved during the day. Counter will reset when unit is powered off.

7A) Vgrid: Measured instant grid voltage Vgrid Avg: Average grid voltage during the last 10 minutes of operation

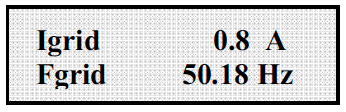
8A) Igrid: Measured instant grid current
Fgrid: Measured instant grid frequency
9A) Vin1: Instant input voltage measured at channel 1 input Iin1: Instant input current measured at channel 1 input

10A) Vin2: Instant input voltage measured at channel 2 input Iin2: Instant input current measured at channel 2 input


In a configuration with one input connected and a second input connected in parallel, this screen is shown instead of the 2 screens described in 9A) and 10A).
11A) Pin1: Measured instant input power of channel 1
Pin2: Measured instant input power of channel 2

In a configuration with one input connected and a second input connected in parallel, this screen is shown instead of the screen described in 11A).

12A) Riso: Measured insulation resistance. Unlike the parameters discussed above, this is not an instant value but a one-of-a-kind measurement taken upon inverter start-up.

13A) If all items described above tested OK, the inverter shows a corresponding message in
the display top line along with date and time. Clock malfunctioning or other nonfunction-
related faults (meaning such faults that do not affect the inverter’s ability to
generate energy) are shown in the bottom line of the display in place of date and time.
The following error messages are provided:

When the grid connection sequence described in section “First phase – electric parameter check” and all electrical parameter checks are completed, other screens become available. These screens let you monitor inverter operation.
Pressing the ESC key (right next to display) gives access to 3 new screens:

Select the Statistics menu to display the following submenu:
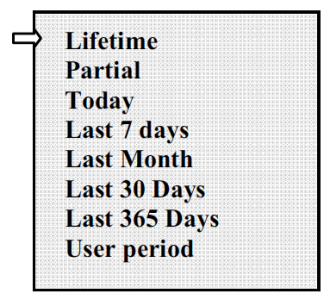
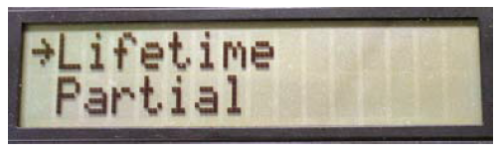
The display has 2 lines; use the keys at the side of the display to scroll through items or open the corresponding submenus as described in section “First phase – electric parameter check”. An arrow on the left side of the display highlights your current selection as shown in the following figure:
Select Lifetime to view the following information:
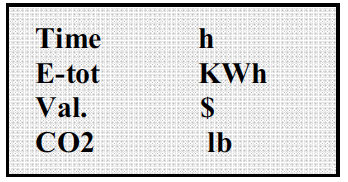
Time: Lifetime operation time
E-tot: Lifetime energy output
Val.: Money earned
CO2: CO2 saving compared to fossil fuels
Select Partial to view the following information:
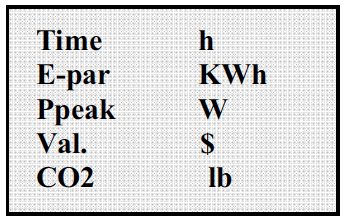
Time: Total operation time since counter was last reset * E-par: Total energy output since counter was last reset * PPeak: Maximum peak power measured since Partial counter was activated Val.: Money earned since counter was last reset * CO2: CO2 saving compared to fossil fuels since counter was last reset * * Hold the ENTER key (4th key from display) depressed for over 3 seconds to reset all counters in this submenu. After 3 seconds, a warning sound is repeated 3 times.
Select Today to view the following information:
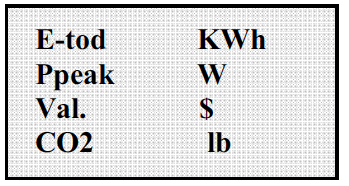
E-tod: Total energy output during the day
Ppeak: Peak power achieved during the day
Val: Money earned during the day
CO2: CO2 saving compared to fossil fuels during the day
Select Last 7 days to view the following information:
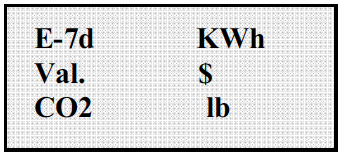
E-7d: Total energy output during the last 7 days Val.: Money earned during the last 7 days CO2: CO2 saving compared to fossil fuels during the last 7 days
Select Last Month to view the following information:
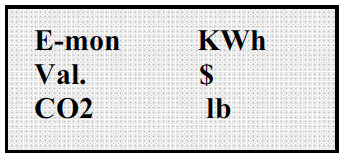
E-mon: Total energy output during the month
Val.: Money earned during the month
CO2: CO2 saving compared to fossil fuels during the month.
Select Last 30 Days to view the following information:
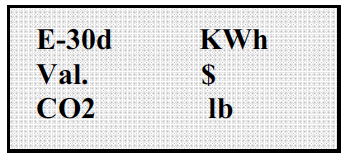
E-30d: Total energy output during the last 30 days Val.: Money earned during the last 30 days CO2: CO2 saving compared to fossil fuels during the last 30 days
Select Last 365 Days to view the following information:
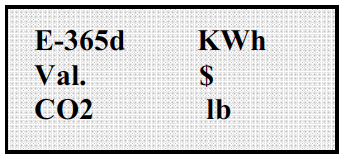
E-365d: Total energy output during the last 365 days Val.: Money earned during the last 365 days CO2: CO2 saving compared to fossil fuels during the last 365 days

This feature measures energy saving during a period selected by the user.
Press ENTER from the “User period” screen to access the following submenu:

Use the display keys to set the start and end date of the period as follows:
Use ENTER to move from one field to the next (from left to right)
Use ESC to go back to the previous field (from right to left)
Press ESC repeatedly to go back to the previous menus as described in “First phase – electric parameter check”
If set dates are inconsistent, the display alerts the user to the problem:

Download the printable Instructions.
Follow Us