The SolarEdge monitoring portal provides a variety of site-specific performance views. The toolbar at the top of the window provides access to these main windows, as follows:
The toolbar at the top right of the window provides the following options:
Clicking your user name dropdown list displays the following:
The Dashboard provides a high-level view of the information collected by the SolarEdge monitoring portal for a specific site.
To view the Dashboard, click the icon at the top-left of the screen.
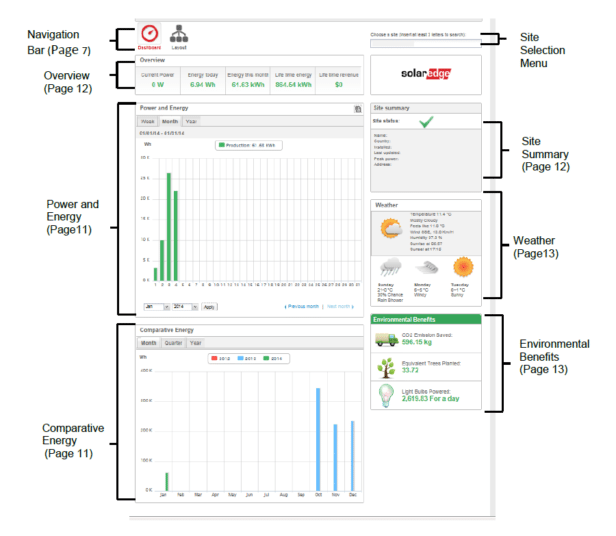
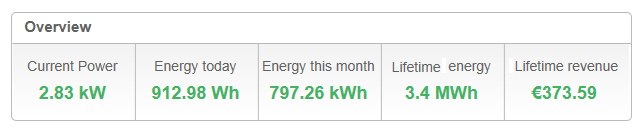
The Overview area shows accumulated energy and revenue for this site. Each box specifies a value and its measurement unit.
The revenue is calculated by multiplying the site-specific feed-in tariff per kWh by the actual energy produced. The revenue is displayed in the currency predefined by the user.
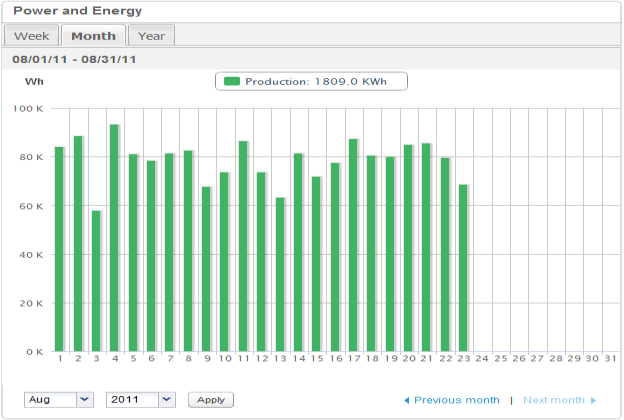
Power and Energy chart shows the power production of this site over a specified period. The default period is the current month.
The X-axis represents time and the Y-axis represents the power produced in kW (when in Week view), or the energy produced in kWh (when in Month or Year view). Use the tabs above the graph to select the desired view.
Power level is a function of variable factors, such as the irradiance level and ambient temperature. Therefore the power-curve typically rises and falls each day.
If there is a data connection between a production meter and your SolarEdge system, then the production data displayed here is taken from the meter’s readings. If not, the data is taken from your site inverter or module production readings.
If a consumption meter is installed, a separate Consumption meter bar is displayed in the graph. The Consumption meter reading represents your home use energy consumption.
You can view energy consumption, energy production or both by clicking Production and/or Consumption.
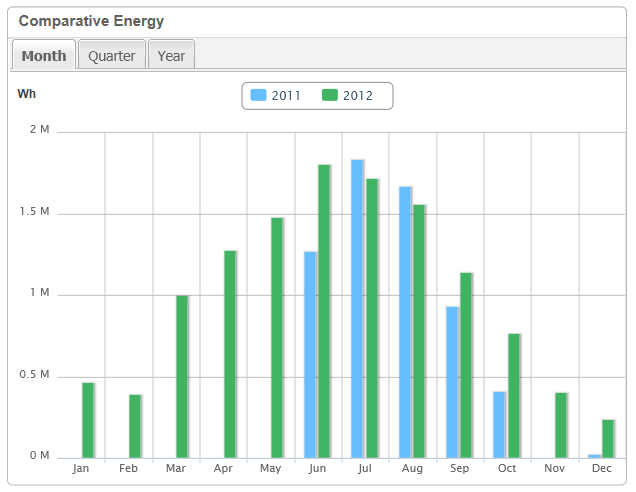
The Comparative Energy chart compares the energy produced at the site during corresponding periods in previous years. You can select to compare months or quarters of different years, or even entire years’ output.
The Site Summary box displays general information about the site: Status, name, location, date installed, date the information was last updated, and the site’s peak power.
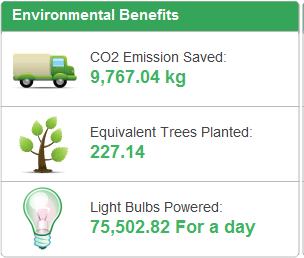
The Environmental Benefits area shows the accumulated impact that non-renewable energy producing methods would have had on the environment had they have been used to produce the amount of energy generated by your home.
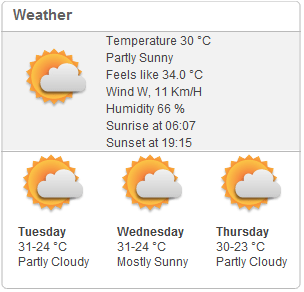
The Weather area shows the current weather conditions together with other details as well as the forecast for the next few days. This information may be helpful when estimating future power production levels.
Note: Weather data is gathered from a weather station near the installation site so might not reflect exact weather at your home.
Layout window shows a schematic outline that represents inverters, their strings and the modules in each string. Near-real-time performance data is displayed for these components.
To view the Layout, click the icon at the top-left of the screen.
Use the Layout window to:
The Layout window offers both Logical Layout and Physical Layout views, as follows:
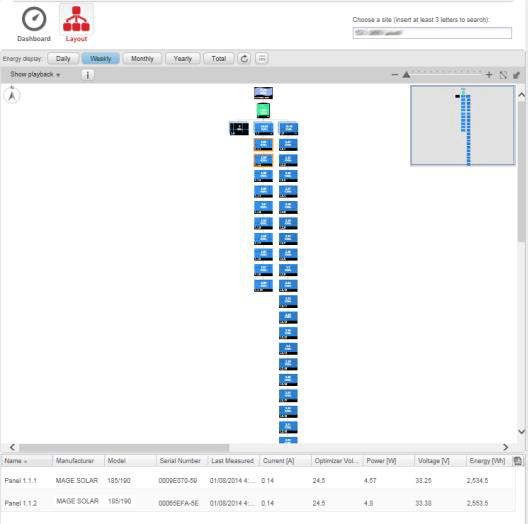
The Logical Layout window shows a schematic logical layout of the components in the fields: inverters, strings, modules and their electrical connectivity. This layout displays a logical view of the installation site, showing which modules are connected in each string, which strings are connected to each inverter, etc.
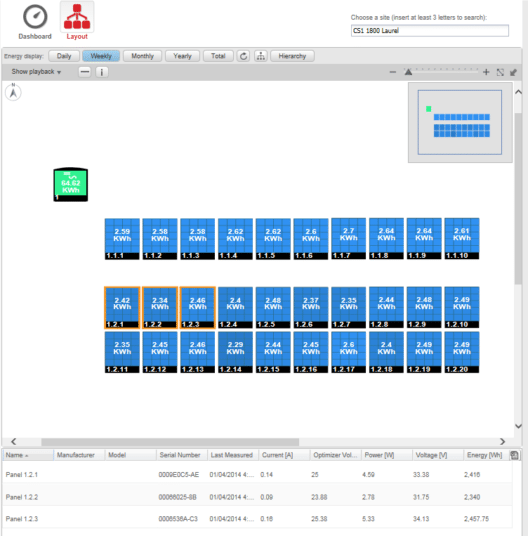
The Physical Layout schematic shows a layout of the components in the field: inverters, clusters, strings, modules and their physical arrangement in the installation site. This layout offers a virtual bird’s eye view of the system’s components and their location, which functions as a usable tool for troubleshooting maintenance problems.
The following shows the Physical Layout diagram of the installation for which Logical Layout was shown above:
Follow Us